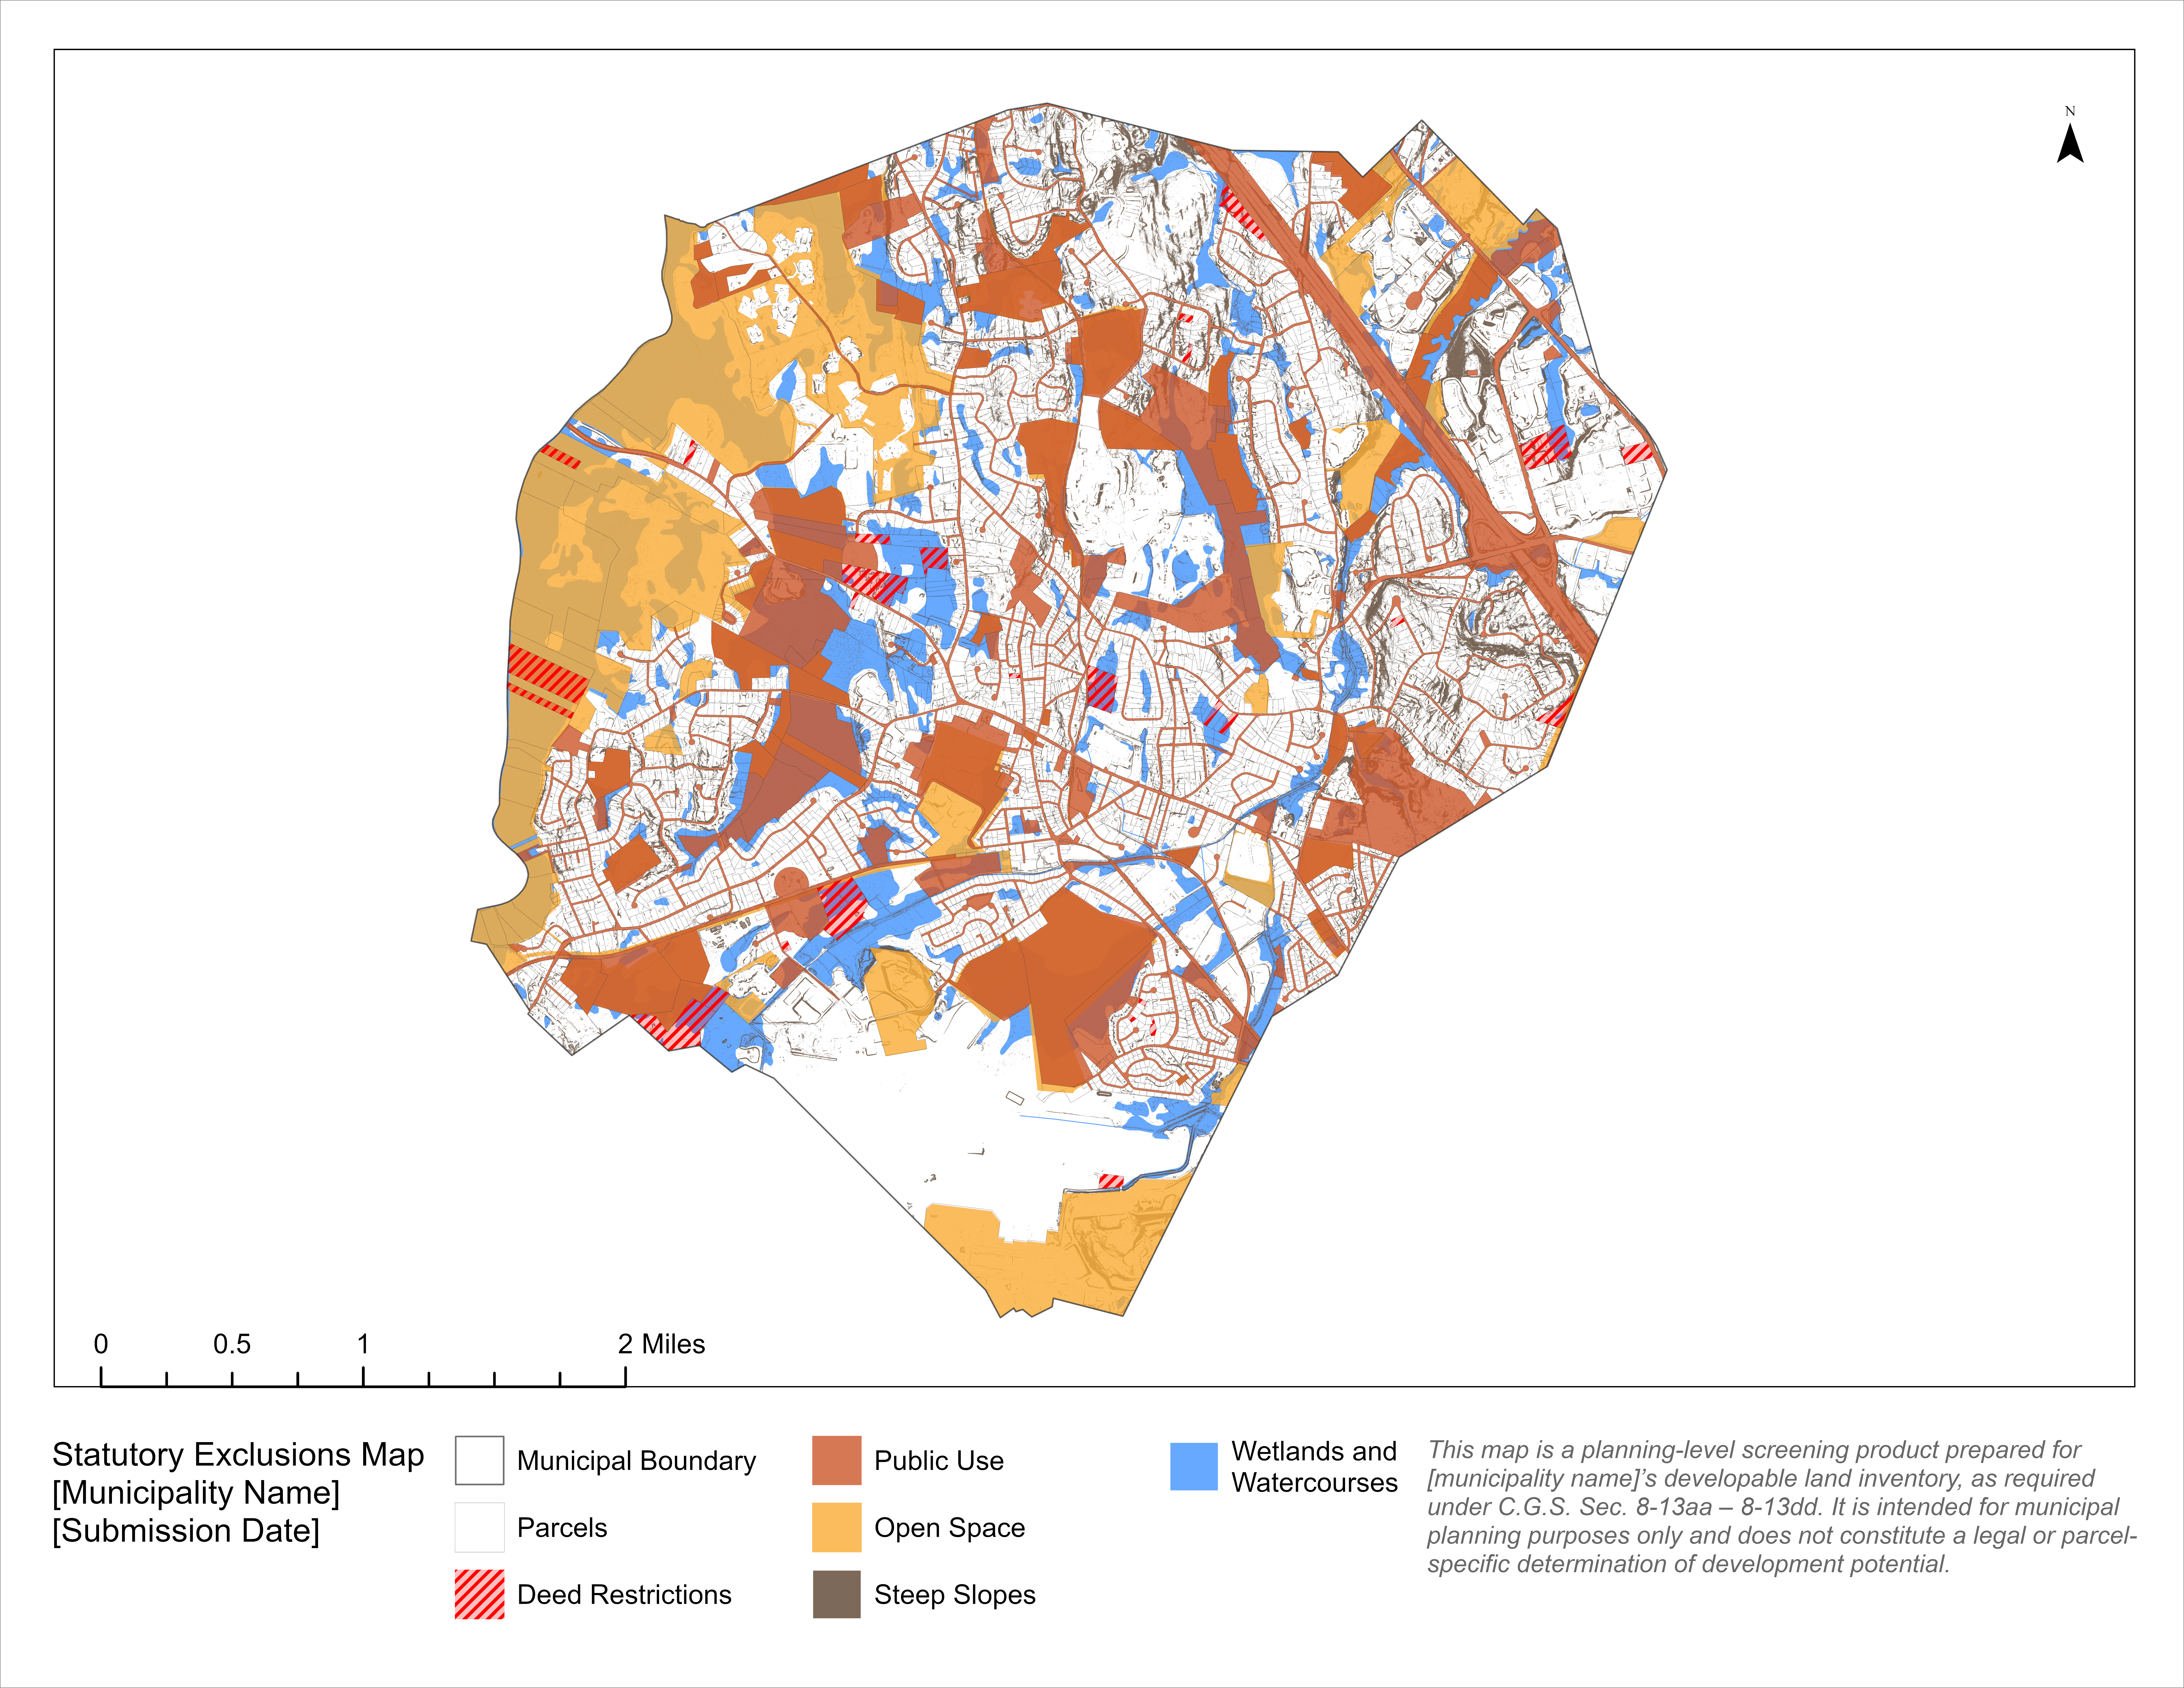
Map Layer (top to bottom) | Description | Symbology | ||
|---|---|---|---|---|
Fill | Outline | Transparency | ||
Municipality boundary | Municipal boundary delineating the extent of the study area | None | 0.6 pt, | 0% |
Parcels | Municipal parcel boundaries, used only for visual context | None | 0.1 pt, | 30% |
Land subject to enforceable restrictions or prohibitions on development | Exclusion category described in Section 3.3 | Hatched & Solid, | None | 0% hatch lines, |
Land already committed to public use or purpose | Exclusion category described in Section 3.1 | Solid, | None | 20% |
Open space, parks, and recreation areas dedicated to the public or protected by a conservation easement | Exclusion category described in Section 3.2 | Solid, | None | 20% |
Areas of 0.5 acres or more of contiguous land that are unsuitable for development due to topography (such as steep slopes) | Exclusion category described in Section 3.5 | Solid, | None | 15% |
Wetlands or watercourses, as defined in the Wetlands and Watercourses Act (CGS Chapter 440) | Exclusion category described in Section 3.4 | Solid, | None | 40% |
5 Creating the Maps
The developable land inventory analysis is a required plan element of the Housing Growth Plan. It is not a required element of the Regional Needs Assessment. The Guidelines recommend that this analysis be presented through a combination of maps and narrative, and this section focuses on the maps used to present that analysis in the Housing Growth Plans.
The developable land inventory process is a preliminary planning-level screening product. It is primarily analytical in nature, involving the identification and documentation of qualifying areas through the application of knowledge, data, and methodology. A map is not the mechanism by which developable areas are identified, nor does it constitute a determination of a property’s development potential. Rather, it serves as a visual representation of the underlying analysis, allowing the results to be verified and understood spatially.
To support Housing Growth Plan reporting and review, the developable land inventory should be presented in the report as municipality-wide maps. The maps should clearly display the location and distribution of developable land using clear, accessible, and consistent symbology.
The maps should incorporate the following data:
- Identified land per the statutory definitions (Section 3)
- Identified vacant parcels (Section 4)
- Identified parcels with redevelopment potential (Section 4)
At a minimum, the following maps should be included in the Housing Growth Plan:
Statutory Exclusions Map: A municipality-wide map displaying each statutory exclusion category as a separate layer and symbolized distinctly to illustrate the distribution of land excluded from the developable land inventory, per the statutes.
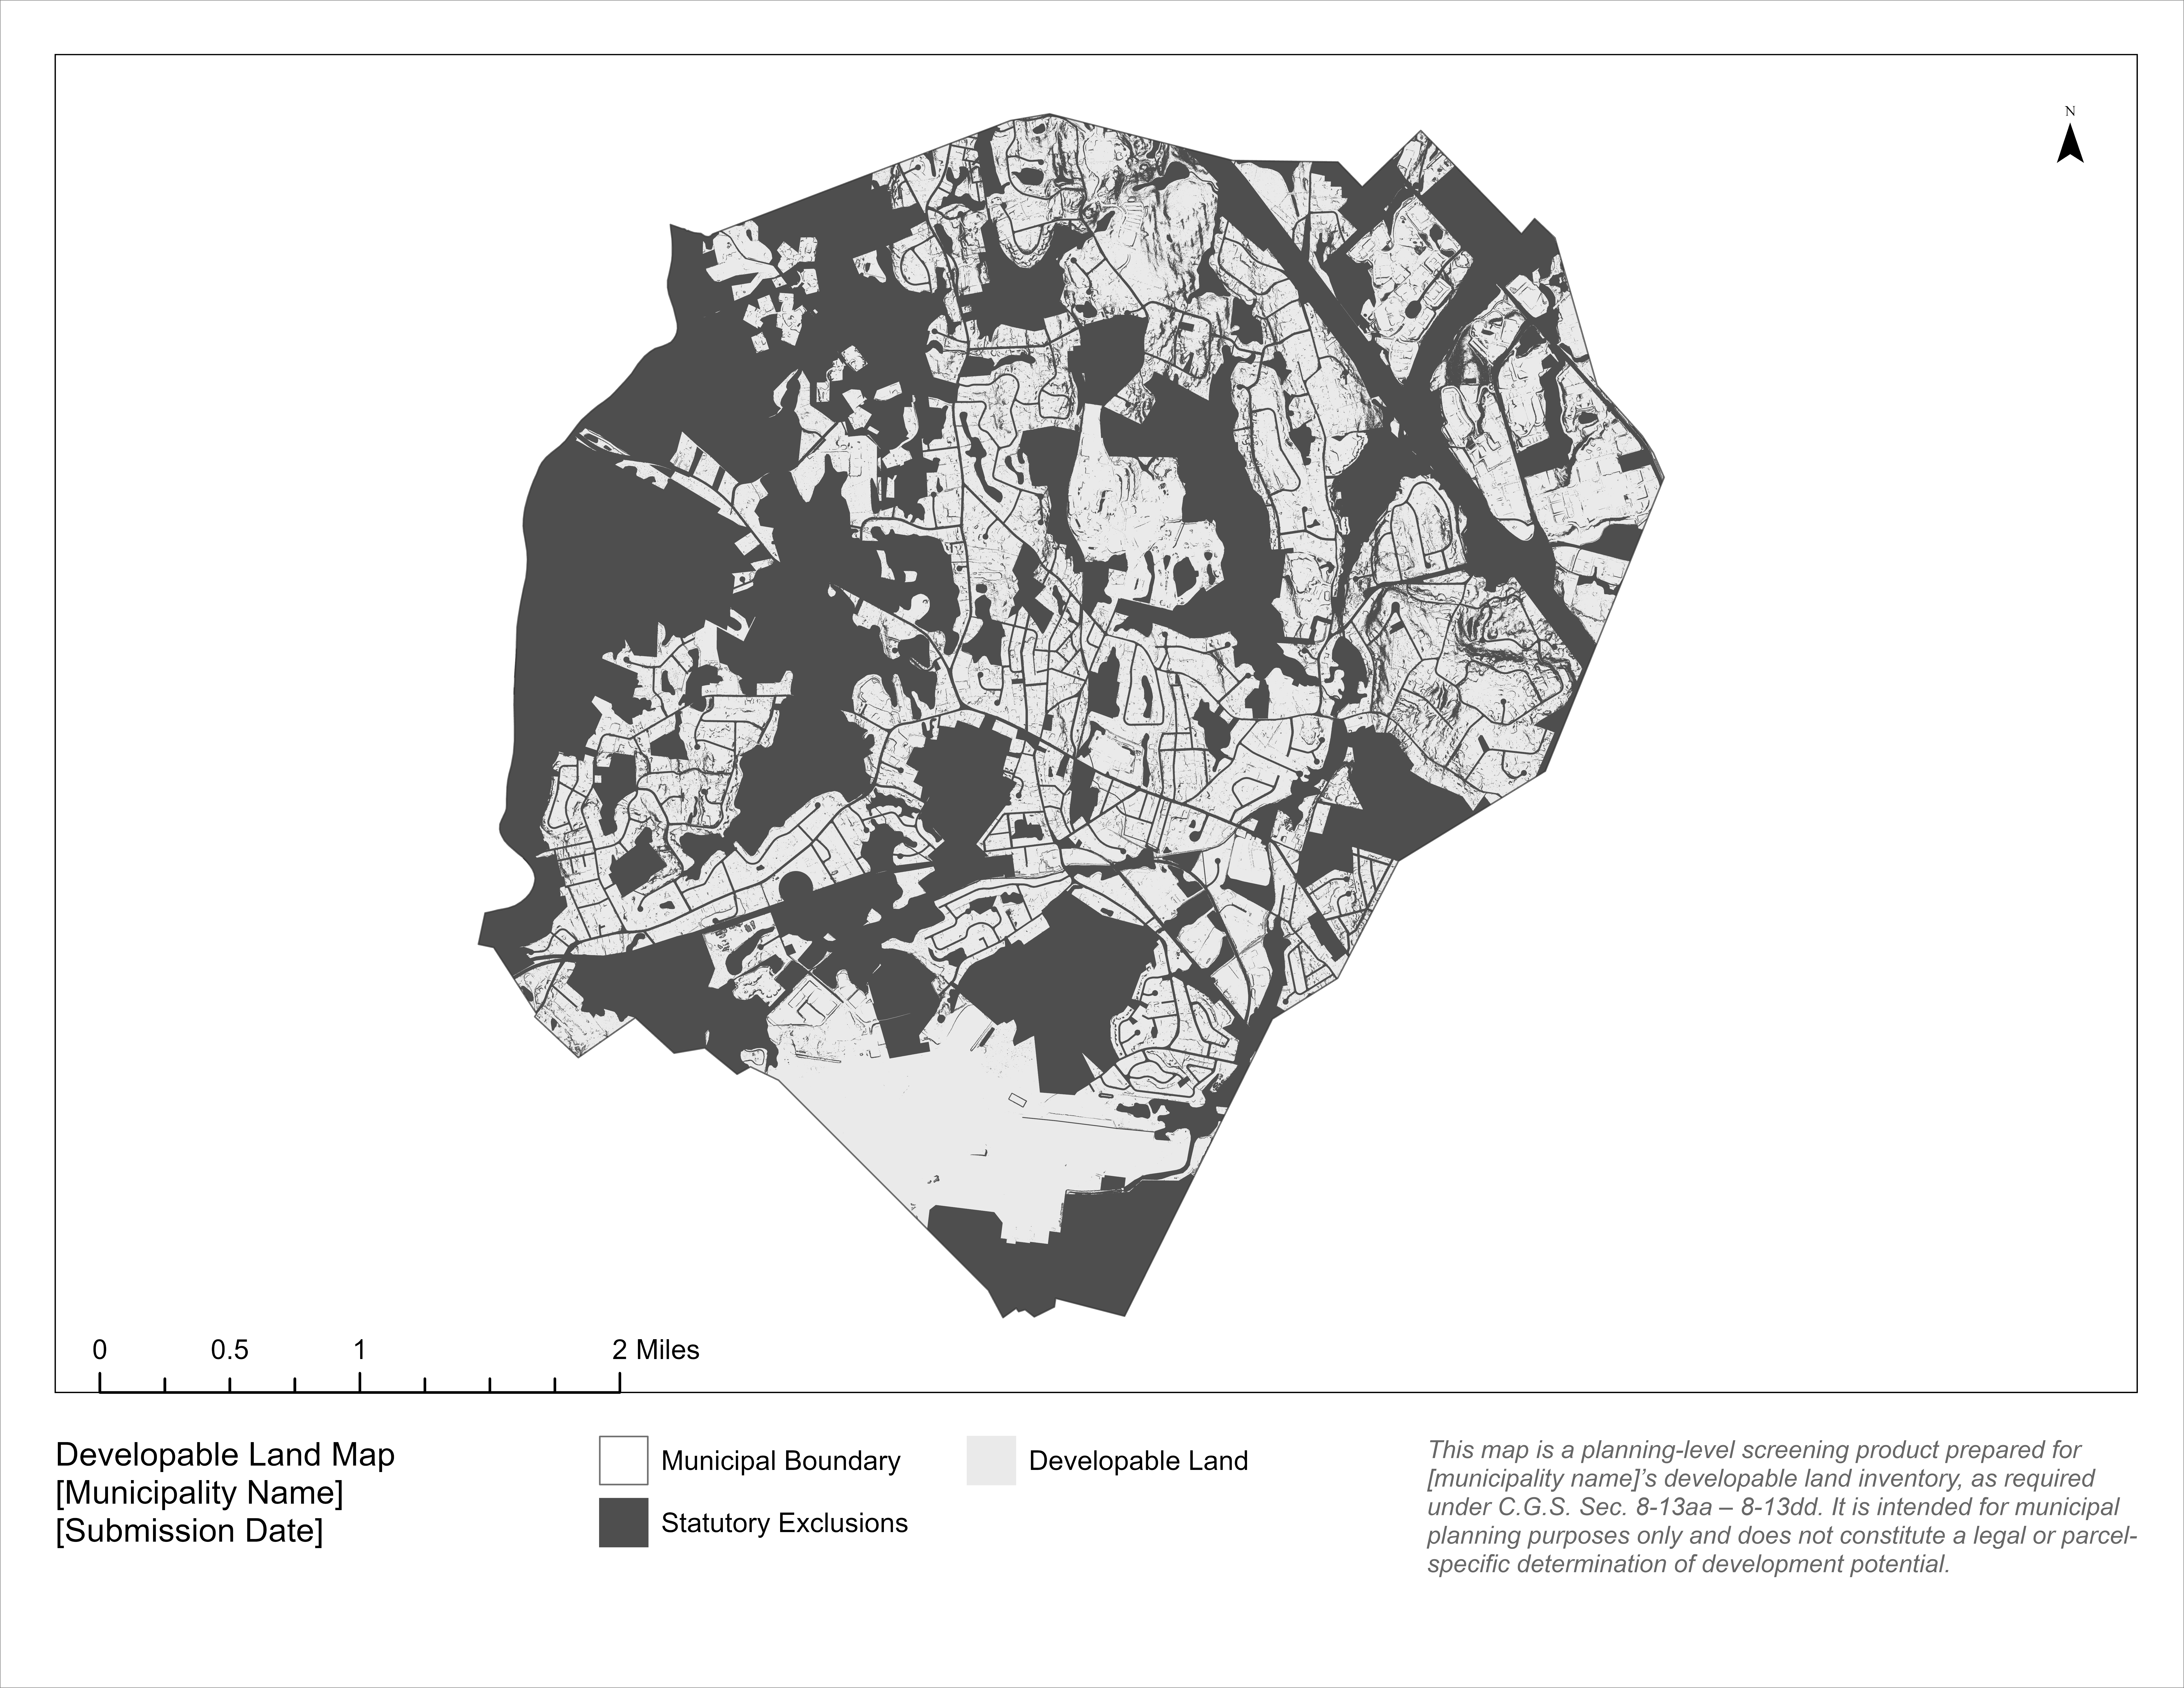
Developable Land Map: A municipality-wide map depicting all land that meets the statutory definitions of developable land, shown as a single consolidated layer. Land excluded under the statutory definitions, or otherwise deemed commercially infeasible to develop, is shown as a separate consolidated layer. Together, these layers provide a simplified representation of land suitability across the municipality for purposes of this planning analysis.
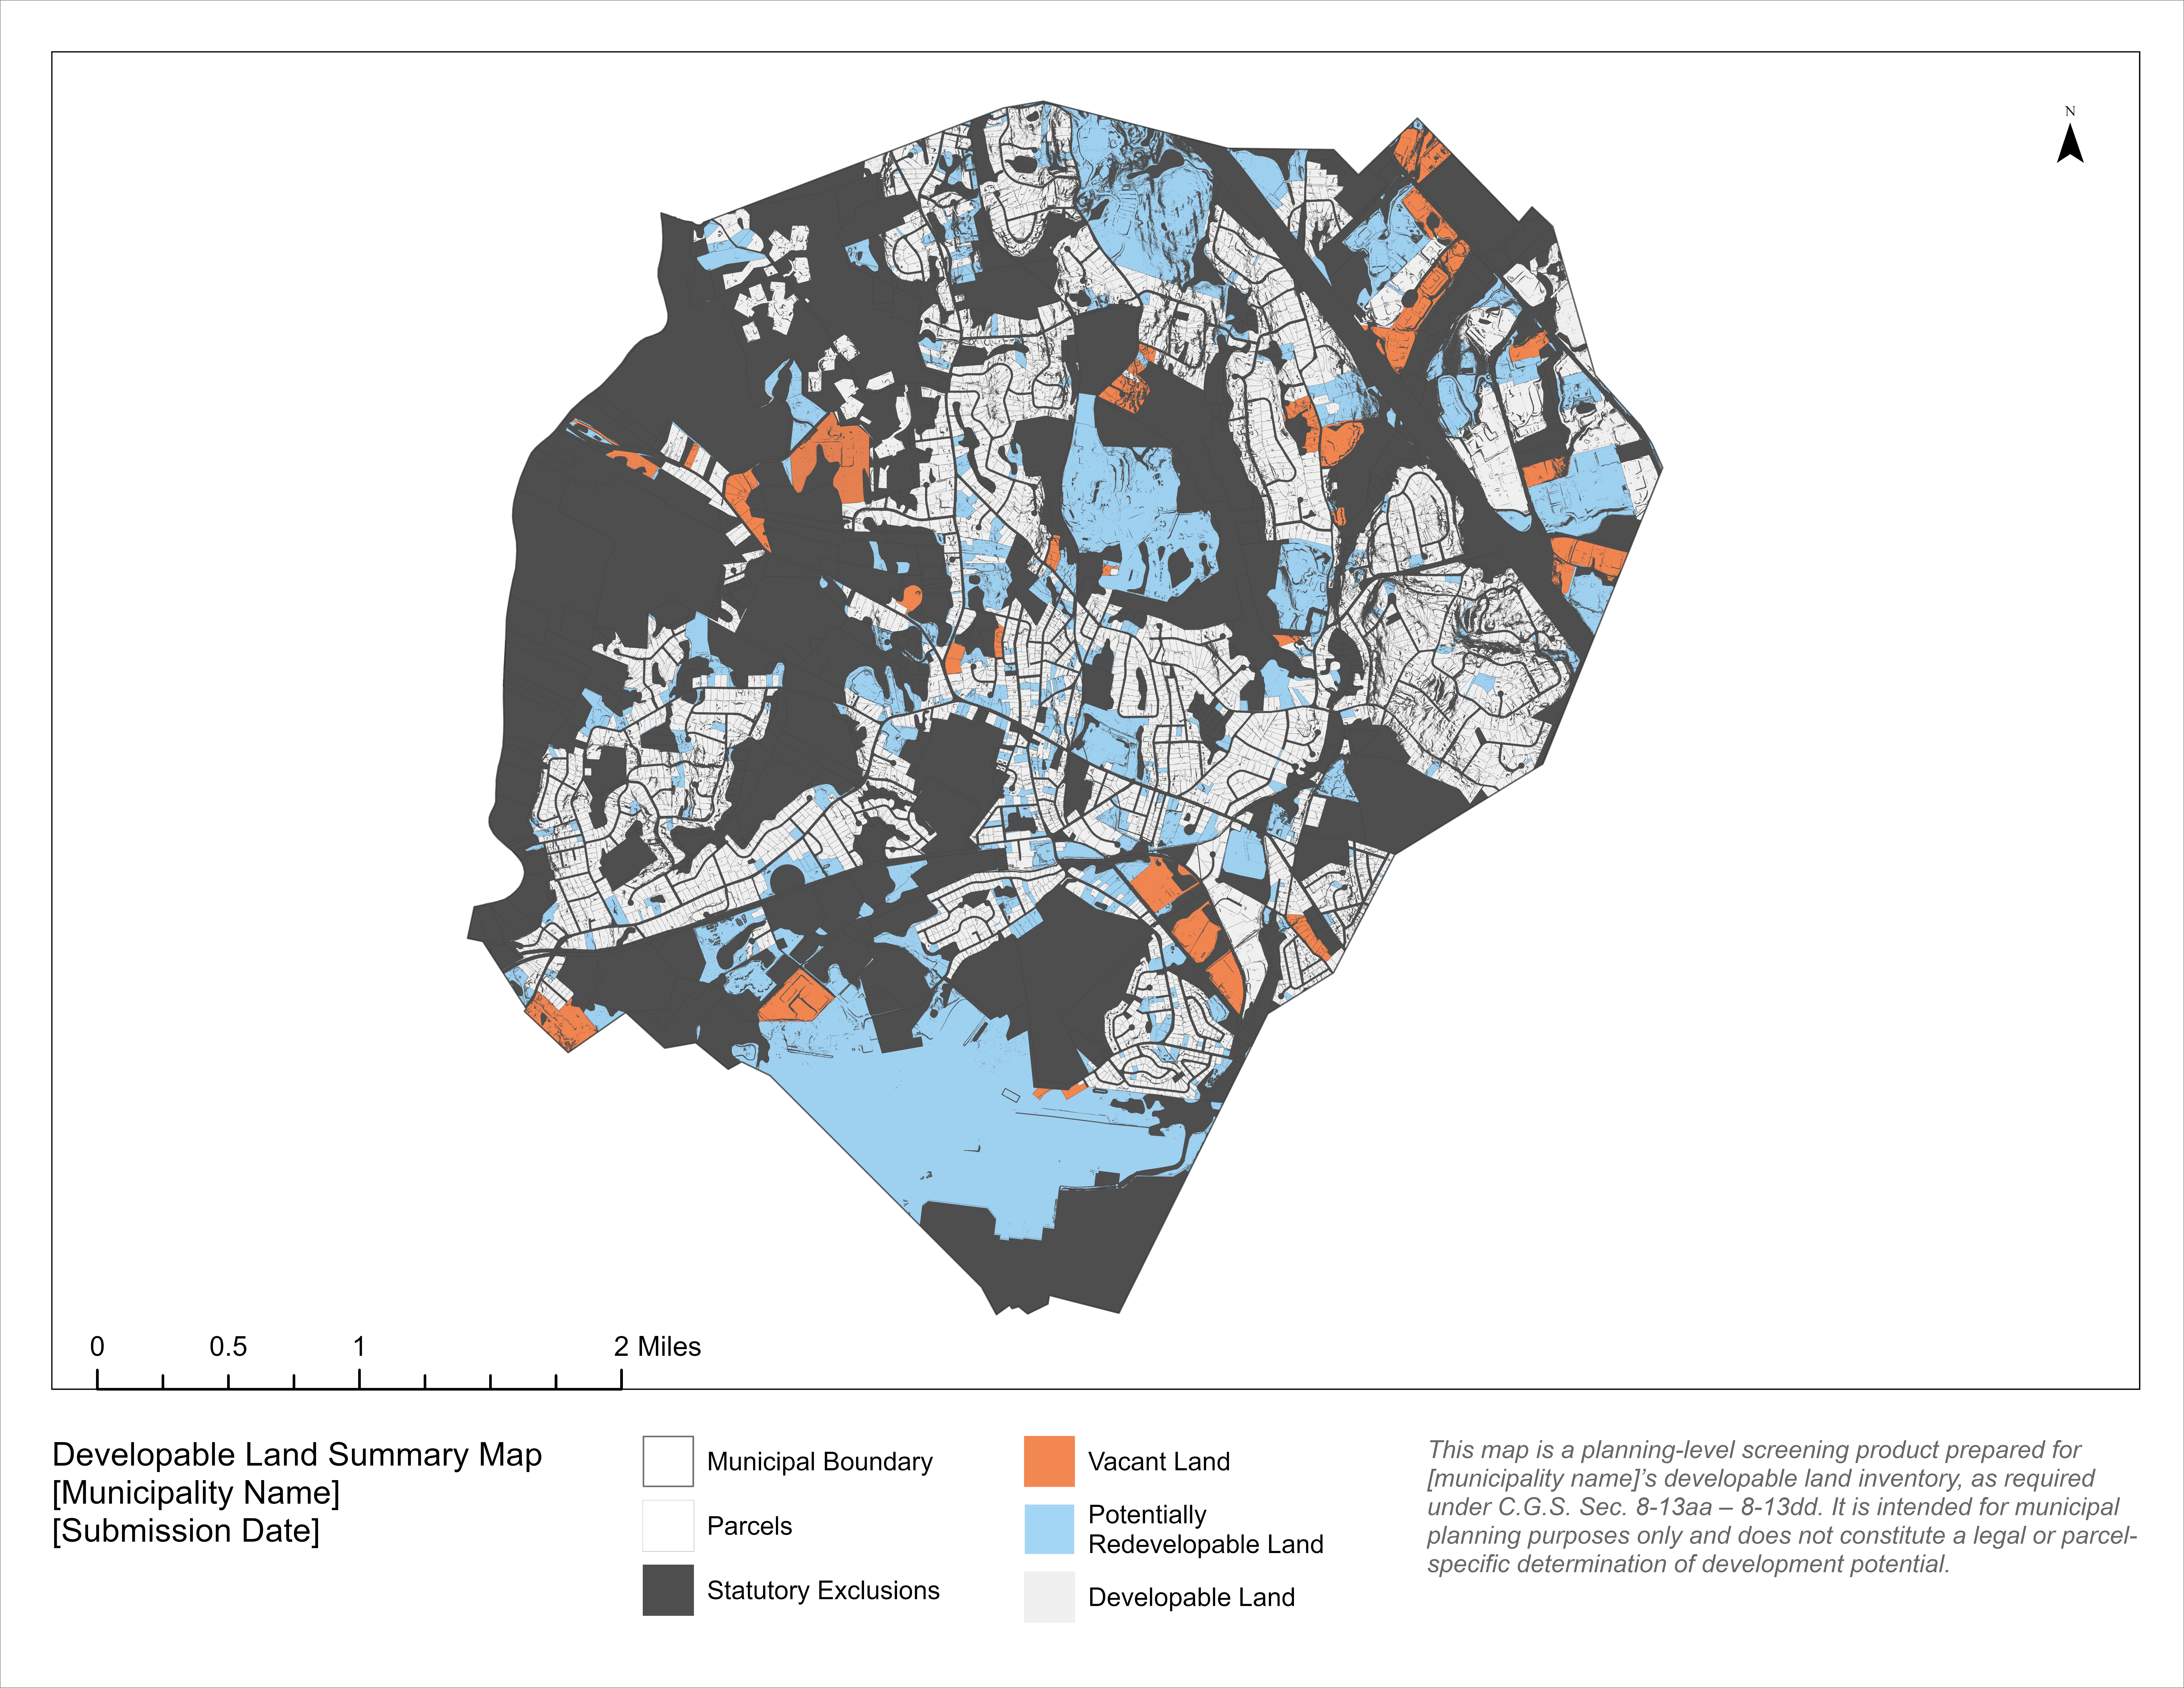
Developable Land Summary Map: A municipality-wide map displaying land deemed developable for this planning analysis, alongside land excluded under the statutory definitions or otherwise deemed infeasible to develop, each shown as a separate consolidated layer. Identified vacant parcels and parcels with redevelopment potential should be displayed as separate overlays.
5.1 Map Layers and Symbology
The following mapping standards should be applied for all final maps included in the report. Any deviations should be explained in a brief narrative detailing what was changed and why. Adherence to these standards ensures consistency across all 169 municipalities statewide.
All maps include the municipal boundary layer to delineate the geographic extent of the study area.
Dataset: CT Municipalities (CT Geodata Portal)
Municipal parcel boundaries may be included where appropriate to provide spatial context for interpretation of mapped datasets.
Dataset: Connecticut CAMA and Parcel Layer (CT Geodata Portal)
Map Elements
All maps should include:
- Municipality-wide extent
- Clear map title
- Municipality name
- Legend identifying all mapped categories
- Note on Intended Use, clarifying that the map is a planning-level screening product and not a legal or parcel-specific determination of development potential
Note on Intended Use
Each map should include a brief note clarifying the purpose and limitations of the developable land inventory. This helps ensure that the map is not misread as a legal or parcel-specific determination of development potential. Municipalities may adjust the language below as needed, provided the core message is retained.
Suggested language:
This map is a planning-level screening product prepared for [municipality name]’s developable land inventory, as required under C.G.S. Sec. 8-13aa – 8-13dd. It is intended for municipal planning purposes only and does not constitute a legal or parcel-specific determination of development potential.
Symbology
- Statutory Exclusions Map
View full-size map

- Developable Land Map
Map Layer (top to bottom) | Description | Symbology | ||
|---|---|---|---|---|
Fill | Outline | Transparency | ||
Municipality boundary | Municipal boundary delineating the extent of the study area. | None | 0.6 pt, | 0% |
Statutory exclusions | Areas excluded from the developable land inventory (not commerically feasible and/or meet statutory exclusion categories from Section 3). Combined into a single layer. | Solid, | None | 0% |
Developable land | Land deemed developable per the statutory definitions. Combined into a single layer. | Solid, | None | 30% |
View full-size map

- Developable Land Summary Map
Map Layer (top to bottom) | Description | Symbology | ||
|---|---|---|---|---|
Fill | Outline | Transparency | ||
Municipality boundary | Municipal boundary delineating the extent of the study area | None | 0.6 pt, | 0% |
Parcels | Municipal parcel boundaries, used only for visual context | None | 0.1 pt, | 30% |
Statutory exclusions | Areas excluded from the developable land inventory (not commerically feasible and/or meet statutory exclusion categories from Section 3). Combined into a single layer | Solid, | None | 50% |
Vacant areas | Areas identified as vacant in Section 4.1 | Solid, | None | 15% |
Areas with redevelopment potential | Areas identified as having redevelopment potential in Section 4.2 | Solid, | None | 35% |
Developable land | Land deemed developable per the statutory definitions. Combined into a single layer | Solid, | None | 35% |
View full-size map
